Showing posts with label Canada. Show all posts

July 30, 2010

Response to George

Would reducing or eliminating America's dependence on foreign oil undercut the economic basis of Islamophobia?

It might to a degree, but not nearly to the extent that it might have if this was the mid 70s. Although I was only a teenager at the time, the mid 70s seemed to be the main era when Islamophobia was based largely on economics. The trigger event was the oil crisis of '73-'74, which awakened the Western public to both their oil dependence and the fact that Middle Eastern society (in particular) was being built upon petrodollars. This awakening brought about a number of articles that I remember reading which tended to be anti-Arab, anti-Islam. One cartoon I remember from that era showed an Arab sheikh in his thobe and kaffiyah standing on the rim of the Grand Canyon and being told by a man in a business suit behind him that "It's not for sale." (This reminds me of the late 80s, when Japanese businesses began buying up a lot of American businesses and properties, with a resultant backlash against the Japanese at that time; Michael Crichton cashed in on that xenophobia with his book (and movie), Rising Sun.)

But since the mid 70s I'd say that the economic basis for Islamophobia has dwindled fairly dramatically. American Islamophobia today tends to be rooted in a lot of other, non-economic factors (e.g., terrorist acts committed by Muslims, American military misadventures in the Middle East (Lebanon, Iraq) and Central Asia (Pakistan, Afghanistan), the Iranian hostage crisis and the dysfunctional diplomatic relationship between the US and Iran ever since, America's blind support for Israel, and the rise of a more visible, more active Muslim community, both in the U.S. and worldwide, that scares American non-Muslims both politically and religiously).

As for foreign oil, as of two years ago (June 2008, when I last wrote about this), five of the top ten countries the U.S. imported oil from were non-Muslim: Canada (who was the #1 seller of crude oil to the US at the time), Mexico, Venezuela, Angola and Ecuador). The first three of those countries provided over 44% of all the U.S.'s imported crude oil. So the U.S. is not quite as dependent upon oil from Muslim countries as perhaps they were in the past.

Personally, I don't think that, even if the U.S. didn't buy a single drop of crude oil from a Muslim country, that would stop all the Islamophobia in the U.S. Many Americans simply can't live without having someone else to hate. Some Muslims haven't helped the American (and worldwide) Muslim community with their actions, but Muslims aren't the only group currently being vilified in the U.S. at the moment. The Hispanics can attest to that.

March 10, 2010

"We know where you're going!"


This is an amusing if unsurprising graph from Chris Blattman's blog, who snarkily writes:

Edmonton’s water utility published this graph of water consumption during last Sunday’s gold medal Olympic hockey game. Roughly 80% of Canadians were watching.

I believe the beer consumption picture looks exactly the same, but upside down.

This reminds me of when I was a teenager; my family loves to watch ice hockey, and we went to many games at the local college. There was one character in particular (a season ticket-holder) who would get up in the middle of the second period during every freakin' game to go to the bathroom, and all his friends would start singing, "We know where you're going! We know where you're going!" :)

June 28, 2009

2008 Oil Reserves Analysis

The Economist had a recent graph showing oil reserves as of the end of 2008, with the number of years remaining for each country's reserves at the 2008 rate of production. I posted a similar graph from The Economist back in June 2006, so we'll do a little analysis to see how things have gone in the past three years.

First, there have been some changes in the rankings for total reserves. The top four (Saudi Arabia, Iran, Iraq and Kuwait) remain the same, but Venezuela has moved up one notch, replacing the UAE in fifth place. Russia remains at #7, but Libya has moved up to #8, replacing Kazakhstan. Numbers 10 (Nigeria), 11 (United States) and 12 (Canada) remain the same, but Qatar has moved ahead of China for 13th place. Angola comes in at #15 in the 2008 chart, up four places. Eight countries that were on the 2005 chart were omitted this time (in alphabetical order): Algeria, Azerbaijan, Brazil, India, Mexico, Norway, Oman, and Sudan).

The 2005 chart mentioned that if production were to continue at 2005's level of production, the world would have 41 years' worth of oil left. The good news is that, three years on, global supplies should actually last for another 42 years.

Doing a quick-and-dirty analysis, we can find out which countries have been winners over the past three years and which were losers. Winners are those countries whose reserves will survive longer today than they were expected to last in 2005's estimate, taking into account the three years of production that have passed. (This could happen either because more oil reserves have been proved in the past three years, because production slowed down, or both.)

In fact, all of the countries were winners, except for three; the winners being: Saudi Arabia (3.5 years), Iraq (3), Kuwait (2.6), Venezuela (30!), Russia (3.8), Libya (4.6), Nigeria (10.6), United States (3.4), Canada (12.1), Qatar (19.1), China (2.1), and Angola (2.7).

The three losers were Iran (-3.1), the UAE (-4.3), and Kazakhstan (-7.0).

The full Economist article:

Although the price of oil peaked at $147 a barrel in 2008, the world’s proven oil reserves—those that are known and recoverable with existing technology—fell only slightly, to 1,258 billion barrels, according to BP, a British oil company. That is 18% higher than in 1998. OPEC tightened its grip slightly in 2008, and commands slightly more than three-quarters of proven reserves. Saudi Arabia and Iran together account for almost one-third of the total. Venezuela, with nearly 8%, has the largest share of any non-Middle Eastern country. BP reckons that if the world continues to produce oil at the same rate as last year, global supplies will last another 42 years, even if no more oil reserves are found.

June 8, 2009

Mikhail Gorbachev: "We Had Our Perestroika. It's High Time for Yours."

There's a good essay by Mikhail Gorbachev, the former leader of the USSR, in The Washington Post. He argues, correctly, IMO, that America's political and economic systems are broken and in need of reform, although he offers no solutions.

I would offer several suggestions in all seriousness: look to Islam for guidance on economic and financial reform, and look to science fiction (and particularly Kim Stanley Robinson's Mars trilogy) for guidance on political and cultural reform. People might think I'm offering pie-in-the-sky suggestions, but many people have thought long and hard on all of these issues. For example, Robinson's work highlights some of the negatives and positives of both the current and future political and cultural systems. When Gorbachev writes, "But I am convinced that a new model will emerge...", everything that follows in Gorbachev's sentence has already been discussed in the Mars Trilogy.

I would not offer these suggestions as solutions ready made to be implemented directly, but I do believe that both can be used as the starting points for discussion on how to solve some of the world's problems.

Here are some of the highlights from the essay:

In the West, the breakup of the Soviet Union was viewed as a total victory that proved that the West did not need to change. Western leaders were convinced that they were at the helm of the right system and of a well-functioning, almost perfect economic model. Scholars opined that history had ended. The "Washington Consensus," the dogma of free markets, deregulation and balanced budgets at any cost, was force-fed to the rest of the world.

But then came the economic crisis of 2008 and 2009, and it became clear that the new Western model was an illusion that benefited chiefly the very rich. Statistics show that the poor and the middle class saw little or no benefit from the economic growth of the past decades.

The current global crisis demonstrates that the leaders of major powers, particularly the United States, had missed the signals that called for a perestroika. The result is a crisis that is not just financial and economic. It is political, too.

The model that emerged during the final decades of the 20th century has turned out to be unsustainable. It was based on a drive for super-profits and hyper-consumption for a few, on unrestrained exploitation of resources and on social and environmental irresponsibility.

But if all the proposed solutions and action now come down to a mere rebranding of the old system, we are bound to see another, perhaps even greater upheaval down the road. The current model does not need adjusting; it needs replacing. I have no ready-made prescriptions. But I am convinced that a new model will emerge, one that will emphasize public needs and public goods, such as a cleaner environment, well-functioning infrastructure and public transportation, sound education and health systems and affordable housing.

Elements of such a model already exist in some countries. Having rejected the tutorials of the International Monetary Fund, countries such as Malaysia and Brazil have achieved impressive rates of economic growth. China and India have pulled hundreds of millions of people out of poverty. By mobilizing state resources, France has built a system of high-speed railways, while Canada provides free health care. Among the new democracies, Slovenia and Slovakia have been able to mitigate the social consequences of market reforms.

The time has come for "creative construction," for striking the right balance between the government and the market, for integrating social and environmental factors and demilitarizing the economy.

February 12, 2009

Petroleum and Natural Gas Proved Reserves, 2009, Top 10

This is an annual post; the data is only updated annually. For the 2008 data, please click here.

The Energy Information Administration, a department of the U.S. Department of Energy, has recently released the January 1, 2009 proved reserves for petroleum and natural gas. Proved reserves are the amount of oil and gas in the ground that is "reasonably certain" to be extracted using current technology at current prices. The following are lists of the top ten countries for petroleum and natural gas proved reserves, with their quantities and percentage of the world total for 2009:

Petroleum - Billion Barrels
1. Saudi Arabia - 266.710 (19.87%)
2. Canada - 178.092 (13.27%)
3. Iran - 136.150 (10.14%)
4. Iraq - 115.000 (8.57%)
5. Kuwait - 104.000 (7.75%)
6. Venezuela - 99.377 (7.40%)
7. United Arab Emirates - 97.800 (7.29%)
8. Russian Federation - 60.000 (4.47%)
9. Libya - 43.660 (3.25%)
10. Nigeria - 36.220 (2.70%)

Notes:

  • The world total of proved reserves is 1,342.207 billion barrels of petroleum, an increase of 10.164 billion barrels over 2008's total (a 0.76% increase).
  • The total of the top ten countries makes up 84.71% of the world's proved reserves.
  • Venezuela was the only country to move up in the rankings, having placed seventh in 2008; the United Arab Emirates dropped one place, to seventh.
  • Canada's proved reserves are estimated to be 5.4 billion barrels of conventional crude oil and 173.2 billion barrels of oil sands reserves. (Oil sands are much more costly to refine than conventional crude oil.)
  • Two countries had singificant increases in their amounts of crude oil proved reserves in 2008: Venezuela, with an increase of 12.342 billion barrels, and Libya, with an increase of 2.196 billion barrels. Ten other countries also had increases in their proved reserves as well; however, the highest amount of any of the ten was 442 million barrels (Brazil).
  • Two countries had significant depletions in their amounts of crude oil proved reserves in 2008: Iran, with a decrease of 2.250 billion barrels, and Mexico, with a decrease of 1.149 billion barrels. Thirteen other countries also had decreases in their proved reserves.


Natural Gas - Trillion Cubic Feet
1. Russian Federation - 1,680.000 (26.86%)
2. Iran - 991.600 (15.85%)
3. Qatar - 891.945 (14.26%)
4. Saudi Arabia - 258.470 (4.13%)
5. United States - 237.726 (3.80%)
6. United Arab Emirates - 214.400 (3.43%)
7. Nigeria - 184.160 (2.94%)
8. Venezuela - 170.920 (2.73%)
9. Algeria - 159.000 (2.54%)
10. Iraq - 111.940 (1.79%)

Notes:

  • The world total of proved reserves is 6,254.364 trillion cubic feet of natural gas, an increase of 42.029 trillion cubic feet (a 0.68% increase). (I've noted a discrepancy in the difference between 2008 and 2009, coming up with an increase of 41.714 trillion cubic feet, a difference of 0.315 trillion cubic feet.)
  • The total of the top ten countries makes up 78.35% of the world's proved reserves.
  • There were no changes in the top ten rankings.
  • Twelve countries had increases in their total proved reserves in 2008, for a total of 83.968 trillion cubic feet; however, this was partially offset by decreases in a total of fourteen countries, with depletions of 42.254 trillion cubic feet.

January 8, 2009

Bedtime Music: Gordon Lightfoot - The Wreck of the Edmond Fitzgerald

In my opinion, one of the most important songs from the 70s is that of Gordon Lightfoot's The Wreck of the Edmund Fitzgerald, released on his 1976 album, Summertime Dream. For those of you not familiar with the sinking of the SS Edmund Fitzgerald, the Fitzgerald was a bulk carrier freighter that sailed the Great Lakes. Launched in 1958, she was, for a time, the largest ship on those waters. On November 10, 1975, the Fitzgerald sank in 530 feet (162 m) of water near Whitefish Bay, Ontario, Canada, without having given any distress calls. All 29 men aboard died. The exact cause of the sinking is unknown. An excellent documentary by the Discovery Channel on the sinking of the Fitzgerald (which I have watched) suggests that three rogue waves in succession may have caused the Fitzgerald to take on water into the cargo holds before snapping the ship in half.

What's interesting about this song is the speed with which it was written and recorded. The
Fitzgerald, as mentioned above, sank on November 10, 1975. The sinking was reported in a Newsweek article entitled "Great Lakes: The Cruelest Month," which was published on November 24th. Lightfoot used the article as his inspiration to write the song, which was then recorded in December, 1975.

October 5, 2008

Hey Sarah Palin

Cute.


Hey Sarah Palin, do you tell them in Wasilla
That 4,000 years ago we roamed the planet with Godzilla?
Is it true?
I am so fucking scared of you
As number 2

Hey Sarah Palin, I think Alaska's very pretty
But just 100,000 people more than Oklahoma City
Yes it's true
Go look it up, I'm telling you
Oh man, were through

Chorus
Oh, if you become VP, oh, it's Canada for me (2x)
It's Canada for me

Hey Sarah Palin, did you really once inquire
Whether you could throw library books into a big bonfire?
God, my eyes
This really might be our demise
This pack of lies

Hey Sarah Palin, just because you're good at shootin'
Doesn't mean you have the ammo to negotiate with Putin
Are you on coke?
This fucking country's up in smoke
Oh what a joke

Chorus
Oh, if you become VP, oh what will it mean for me (2x)

Bridge
Just because I can see the moon
Doesn't make me an astronaut, you loon
Your foreign policy expertise is pooh
Do you really think a woman commits
To a candidate just because she has tits
Please tell me that this ticket is not true
I thought that there could be no worse
Than Cheney, but here you are, I curse
The madman who would cast a vote for you
And McCain too

Hey Sarah Palin, is it media distortion
Or would you tell a girl who's raped that she could not have an abortion?
It's a new low
Who knows just how far you would go
I'd rather vote for Ross Perot
Hey Sarah Palin I don't know
Where can we go

Chorus

HT: TBogg

June 19, 2008

Update: How Much Oil Does America Import?

Currently, my most popular blog post by far is How Much Oil Does America Import?, written back in May 2006, two years ago. I thought it was time to update the figures and see how the U.S. is doing since I first wrote that post.

The U.S. gets its oil from two sources: either it pumps its own oil, called "Field Production" by the Department of Energy, or it imports oil from other countries around the world. In 2000, American commercial field production made up 38.69% of the total supply of crude oil, while imports made up 60.28%. In 2005, when I wrote the last post, those same percentages were 33.67% and 65.84%, respectively. (These numbers are different from what I wrote back in 2006 as adjustments have been made to the official statistics; these types of revisions are normal for economic statistics.) In 2007 (the most recent year), the percentages were 33.72% and 66.19%, respectively. While there has been an extremely slight increase in the amount of oil pumped domestically (0.05%), imports have also increased as well. (The reason why both numbers can increase is because a third number, "supply adjustments," fell.)

In 2007, the U.S. imported a total of 3,656,170 thousand barrels. Of those 3.66 billion barrles, the U.S. imported from a total of 46 different countries. The top 5 importing countries were: Canada (18.61%), Saudi Arabia (14.50%), Mexico (14.07%), Venezuela (11.48%), and Nigeria (10.80%), for a total of 69.47% of all American imports. In contrast, imports from countries six through ten (Angola, Iraq, Algeria, Ecuador, and Kuwait) made up only 17.95% of the total; countries 11 through 46 made up the remaining 12.58%.

Looking at petroleum imports in two other ways...
  • In 2007, imports from OPEC countries* made up 53.85% of all U.S. imports, compared to the 46.15% from non-OPEC countries. However, this is the exception rather than the rule. Since 1993, when the Energy Information Agency (EIA) started breaking out the statistics, non-OPEC countries have been the dominant exporters ten years out of the past fifteen. The year 2007 was the first time since 2001 that OPEC countries had sold more petroleum to the U.S. than non-OPEC countries.
  • With respect to the Persian Gulf, those countries** only made up 21.19% of the total imports. This is down slightly, one-half percent, from my 2006 analysis. Note that the U.S. imports no oil from Iran.

    Conclusions/Predictions:
    Two years ago, I made four points as to how I thought things would go with respect to American oil imports and consumption. We'll look at how good or bad those predictions were:

    1. American field production will probably go below 25% of its total annual supply within the next five years.

    I think we can write this prediction off; I don't foresee this happening within the next three years (or perhaps even the next ten).

    2. In that same time frame, imports will probably be in the high 50s percentage (perhaps 58-59%).

    On the other hand, I think this prediction is very much a lock at this time. In fact, I wouldn't be surprised if this number goes back up again, remaining in the 60-65% range.

    3. America will continue to seek the majority of its oil from non-OPEC countries, such as Canada and Mexico, if only to avoid being as dependent on OPEC countries as they have been in the past. However, this will probably turn out to be a pipe dream in the long run unless Canadian oil reserve estimates turn out to be near the high end. (Estimates for Canada's proven oil reserves ranges from 4.7 billion barrels (World Oil) to 14.803 billion barrels (BP Statistical Review) to 178.792 billion barrels (Oil & Gas Journal). Obviously, this extremely wide range of guesses shows that no one truly knows how much oil Canada has.)

    Since I wrote this, I've gotten a better understanding with respect to Canada's oil reserves. The problem with the Canadian oil sands is that it is made up of a very dense and viscous type of petroleum called bitumen. Bitumen is like molasses at room temperature, and needs heating just to flow. (The tar that we pave roads with is bitumen.) Oil refineries are set up to process certain types of crude oils, and bitumen is normally not one of them. So, while Canada has a lot of proved oil reserves, most of it is not in the form the refineries need to produce products like gasoline. In this respect, the lower reserve amount mentioned above is probably closer to the amount of crude oil Canada actually has. In time, more refineries may convert to take advantage of the Canadian oil sands, but that will probably be a gradual process.

    4. Persian Gulf oil, which has ranged between 19.81% and 28.56% of all U.S. imports since 1996, will probably continue to hover in the high teens-low 20s, despite President Bush's goal to cut American consumption of Middle Eastern oil by 75% by 2025, per the latest State of the Union address.

    I don't see this forecast changing at all. What President Bush said in 2006 about cutting the amount of Middle Eastern oil America consumes was complete and utter bullshit (and shame on you if you believed him). BTW, shame on you again if you believe either McCain or Cheney that drilling for oil offshore or up in Alaska will make a significant difference. Two reasons: "drop in the bucket" and "long-term projects," neither of which will lower your gas prices. I may post on this in the near future, insha'allah, but in the meantime I recommend that you read John McCain's Oil Scam over at Informed Comment (Juan Cole), and Drilling Our Way to... by Menzie Chinn over at Econbrowser.


    References:
    US Crude Oil Supply and Disposition (DoE)
    US Crude Oil Imports by Country of Origin (DoE)

    Notes:
    * OPEC countries include Algeria, Angola, Ecuador, Indonesia, Iraq, Kuwait, Libya, Nigeria, Qatar, Saudi Arabia, the UAE, and Venezuela.
    ** Persian Gulf countries include Bahrain, Iran, Iraq, Kuwait, Qatar, Saudi Arabia, and the United Arab Emirates. However, Iran and Qatar export no oil to the U.S.
  • January 15, 2008

    Petroleum and Natural Gas Proven Reserves, 2008, Top 10

    Update: Please click on the link for the 2009 Petroleum and Natural Gas Proved Reserves.

    The Energy Information Administration, a department of the U.S. Department of Energy, has recently released the 2008 proved reserves for petroleum and natural gas. Proved reserves are the amount of oil and gas in the ground that is "reasonably certain" to be extracted using current technology at current prices. The following are lists of the top ten countries for petroleum and natural gas proved reserves, with their quantities and percentage of the world total for 2008:

    Petroleum - Billion Barrels
    1. Saudi Arabia - 266.75 (20.03%)
    2. Canada - 178.59 (13.41%)
    3. Iran - 138.40 (10.39%)
    4. Iraq - 115.00 (8.64%)
    5. Kuwait - 104.00 (7.81%)
    6. United Arab Emirates - 97.80 (7.34%)
    7. Venezuela - 87.04 (6.54%)
    8. Russian Federation - 60.00 (4.51%)
    9. Libya - 41.46 (3.11%)
    10. Nigeria - 36.22 (2.72%)

    Notes: The world total of proved reserves is 1,331.70 billion barrels of petroleum. The total of the top ten countries makes up 84.50% of the world's proved reserves. Canada's proved reserves are estimated to be 5.4 billion barrels of conventional crude oil and 173.2 billion barrels of oil sands reserves. (Oil sands are much more costly to refine than conventional crude oil.)


    Natural Gas - Trillion Cubic Feet
    1. Russian Federation - 1,680.000 (27.16%)
    2. Iran - 948.200 (15.33%)
    3. Qatar - 905.300 (14.64%)
    4. Saudi Arabia - 253.107 (4.09%)
    5. United Arab Emirates - 214.400 (3.47%)
    6. United States - 211.085 (3.41%)
    7. Nigeria - 183.990 (2.97%)
    8. Venezuela - 166.260 (2.69%)
    9. Algeria - 159.000 (2.57%)
    10. Iraq - 111.940 (1.81%)

    Notes: The world total of proved reserves is 6,185.694 trillion cubic feet of natural gas. The total of the top ten countries makes up 78.14% of the world's proved reserves. Venezuela moved past Algeria into the 8th spot for the 2008 listing, having been listed 9th last year.

    August 30, 2007

    Little Mosque on the Prarie: Season 2

    Good news. The Canadian sitcom Little Mosque on the Prarie will return this fall. While the show was not universally loved by Muslims in its first season, I felt that the Muslim community benefited more from having the show broadcast than not. Yes, they didn't portray everything about Islam and the Muslim community correctly in the first season but, then again, who does? Hopefully, there are more Muslims involved with the writing and production for this season than there was last season (when, I believe, only the show's creator, Zarqa Nawaz, and actor Zaib Shaikh (Amaar, the young imam) were the only Muslims involved in the production) to help make the show more realistic in its depiction of Islam and Muslim life. From CBC News:

    Little Mosque on the Prairie is back on the Prairies.

    CBC's hit TV series about Muslims in a fictional Saskatchewan town is wrapping up production in Regina on its second season.

    Producer Michael Snook says on-location shooting for parts of 12 episodes will begin Monday and continue into September. Broadcasts of the second season episodes begin Oct. 3.

    "We'll be shooting five days in Regina over the next couple of weeks and we'll be shooting five days in Indian Head," Snook said.

    The comedy originated in Regina, although CBC ended up moving more than half of the production to a soundstage in Toronto.

    Even so, according to Snook, the sitcom has a strong Prairie component.
    Continue Article

    "The vast majority of our crew are Saskatchewan, some of our day player cast are from Saskatchewan and the core production unit in terms of producer, production manager and so on … are all from here," he said.

    After a successful pilot season, the series is ramping up production from eight episodes to 20.

    Little Mosque on the Prairie will be aired in a number of other markets this year, including France and French-speaking parts of Switzerland and Africa.

    August 5, 2007

    Do You Have a Flag?

    I got a kick out of the following news story (more underneath)...

    Canada on Thursday dismissed Russia's claim to a large chunk of the resource-rich Arctic, saying the tactic was more suited to the 15th century than the real world.

    A Russian submersible on Thursday dived beneath the ice under the North Pole and planted a titanium flag on the seabed, staking a symbolic claim as Moscow seeks to extend the territory in the Arctic it controls right up to the North Pole.

    "This isn't the 15th century. You can't go around the world and just plant flags and say 'We're claiming this territory'," said Canadian Foreign Minister Peter MacKay.

    Why? Because it reminded me of this Eddie Izzard routine (click here for a longer version):


    So there was a lot of that, and we built up empires. We stole countries! That's how you build an empire. We stole countries with the cunning use of flags. Just sail around the world and stick a flag in.

    "I claim India for Britain!"

    And they're going, "You can't claim us. We live here! Five hundred million of us."

    "Do you have a flag?"

    "We don't need a bloody flag; this is our country, you bastard!"

    "No flag, no country! You can't have one. That's the rules... that... I've just made up! And I'm backing it up with this gun... that was lent from the... National Rifle Association."

    June 1, 2007

    "All we are saying..."

    The Economist Intelligence Unit, a division of the corporation that publishes The Economist, has come out with its first annual "Global Peace Index," an index that ranks 121 countries based upon their "peacefulness." One of the irritants I have about certain American Christians and Islamophobes (who are often one and the same) is their claim that the US is sooo peaceful and Muslims are sooo violent. Well, the Global Peace Index exposes the lie behind that claim. Of the 121 countries in this year's index, the US placed 96th, ahead of Iran, but behind Yemen. The most peaceful Muslim country is Oman (22) [see below for a list of the remaining Muslim-majority countries]. Countries of interest: Norway (1), New Zealand (2), Japan (5), Canada (8), Hong Kong (23), Australia (25), Singapore (29), South Korea (32), United Kingdom (49), China (60), India (109), Russia (118), and Israel (119).

    The following comes from the press release that describes the objective of the Index and how the Index was created:

    "The objective of the Global Peace Index was to go beyond a crude measure of wars by systematically exploring the texture of peace," explained Global Peace Index President, Mr. Clyde McConaghy, speaking in Washington. "The Index provides a quantitative measure of peacefulness that is comparable over time, and we hope it will inspire and influence world leaders and governments to further action."

    The rankings show that even among the G8 countries there are significant differences in peacefulness: While Japan was the most peaceful of the G8 countries, at a rank of five in the Index, Russia neared the bottom at number 118. The Global Peace Index also reveals that countries which had a turbulent time for parts of the twentieth century, such as Ireland and Germany, have emerged as peace leaders in the 21st century.

    The Economist Intelligence Unit measured countries' peacefulness based on wide range of indicators - 24 in all - including ease of access to "weapons of minor destruction" (guns, small explosives), military expenditure, local corruption, and the level of respect for human rights.

    After compiling the Index, the researchers examined it for patterns in order to identify the "drivers" that make for peaceful societies. They found that peaceful countries often shared high levels of democracy and transparency of government, education and material well-being. While the U.S. possesses many of these characteristics, its ranking was brought down by its engagement in warfare and external conflict, as well as high levels of incarceration and homicide. The U.S.'s rank also suffered due to the large share of military expenditure from its GDP, attributed to its status as one of the world's military-diplomatic powers.

    The main findings of the Global Peace Index are:
  • Peace is correlated to indicators such as income, schooling and the level of regional integration
  • Peaceful countries often shared high levels of transparency of government and low corruption
  • Small, stable countries which are part of regional blocs are most likely to get a higher ranking

  • Muslim-majority countries: Oman (22), Qatar (30), Malaysia (37), the UAE (38), Tunisia (39), Kuwait (46), Morocco (48), Libya (58), Kazakhstan (61), Bahrain (62), Jordan (63), Egypt (73), Syria (77), Indonesia (78), Bangladesh (86), Saudi Arabia (90), Turkey (92), Yemen (95), Iran (97), Azerbaijan (101), Algeria (107), Uzbekistan (110), Lebanon (114), Pakistan (115), and Iraq (121).

    February 11, 2007

    Canadian Optician Goes Nuts

    There's a very strange news story coming out of Toronto, which I first caught on CNN this morning. Apparently an optician, Adam Plimmer, is cheating his customers by selling fake designer glasses. Part of CNN's coverage this morning, which isn't on the Youtube video below, had interviews with two women who had been cheated out of a considerable amount of money ($700 in one woman's case). When a 75-year-old reporter, Peter Silverman, came to discuss the case with the optician, Plimmer became rather violent, hitting, spitting, and throwing snowballs at Silverman and his cameraman. Plimmer now faces charges of assault and assault with a weapon.


    A Toronto optician has been charged with assaulting a 75-year-old CityTV reporter in Toronto, Canada, according to CityTV.

    The reporter was attacked by the optician on Wednesday while investigating allegations that the optician sold fake designer glasses.

    The confrontation at the doorway of King West Optical, captured by CityTV television cameras, occurred during what was to be the latest installment of Peter Silverman's 'Silverman Helps' segment on the store.

    According to the Canadian television station, Silverman went to question optician Adam Plimmer about his alleged fraudulent business practices after several consumers complained to him that they had paid for glasses but never received them.

    The CityTV video shows Plimmer yelling profanities, hitting, and spitting at Silverman outside his store. It also shows Plimmer throwing snowballs at the reporter.

    CityTV said that Silverman was not injured in the attack.

    The news station said the reporter only put up his fists in self-defense.

    Police arrived to the scene but Plimmer allegedly barricaded himself in the store, which led the emergency task force to come and get him out.

    CityTV reported that Plimmer was later arrested by the police, and now faces one charge of assault and one charge of assault with a weapon.

    The optician is now out on bail.


    (Source)

    May 27, 2006

    How Much Oil Does America Import?

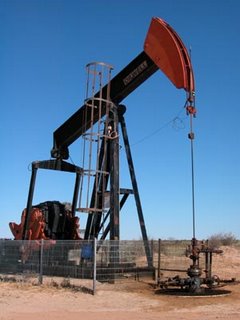
    Oil RigEver since I wrote Oil: America's Smack back in February, I've had a fairly steady stream of visitors asking the same question: how much oil does America import? I touched on this answer in my Smack post, but the question is worth looking into once more.

    Every year, the United States pumps up some of its own oil (called "Field Production" according to the DoE) and imports the rest. Not surprisingly, American field production has been dropping over time. In the year 2000, American commercial field production made up 33.51% of its total supply of crude oil, while imports made up 52.21%. In 2005, those same percentages were 28.44% and 55.85%, respectively. And, of course, there's no reason to expect either of these trends not to continue going down and up, respectively, in the near future.

    The United States has been importing oil since at least 1910 (according to DoE statistics), when a mere 557 thousand barrels of oil were brought into the country. Last year, the U.S. imported 3,670,403 thousand barrels of oil. Of those 3.67 billion barrels of oil, the U.S. imported from a total of 42 different countries. The top 5 importing countries were Canada (16.34%), Mexico (15.42%), Saudi Arabia (14.30%), Venezuela (12.24%), and Nigeria (10.54%), for a total of 68.84% of all American imports. In contrast, imports from countries 6 through 10 (Iraq, Angola, Ecuador, Algeria and the United Kingdom) make up only 16.84% of the total, with countries 11 through 42 making up the remaining 14.33%.

    Looked at another way, only 21.69% of America's oil imports come from the Persian Gulf region. Per the DoE, the Persian Gulf includes Bahrain, Iran, Iraq, Kuwait, Qatar, Saudi Arabia, and the United Arab Emirates; however, Iran and Qatar export no oil to the United States. If we compare imports from OPEC countries vs. non-OPEC countries, we find that non-OPEC countries are now in the majority, 52.64% vs. 47.36%. And, with the exception of one year, 2001, non-OPEC countries have been in the ascendancy since 1994.

    Conclusions/Predictions:
    1. American field production will probably go below 25% of its total annual supply within the next five years.
    2. In that same time frame, imports will probably be in the high 50s percentage (perhaps 58-59%).
    3. America will continue to seek the majority of its oil from non-OPEC countries, such as Canada and Mexico, if only to avoid being as dependent on OPEC countries as they have been in the past. However, this will probably turn out to be a pipe dream in the long run unless Canadian oil reserve estimates turn out to be near the high end. (Estimates for Canada's proven oil reserves ranges from 4.7 billion barrels (World Oil) to 14.803 billion barrels (BP Statistical Review) to 178.792 billion barrels (Oil & Gas Journal). Obviously, this extremely wide range of guesses shows that no one truly knows how much oil Canada has.)
    4. Persian Gulf oil, which has ranged between 19.81% and 28.56% of all U.S. imports since 1996, will probably continue to hover in the high teens-low 20s, despite President Bush's goal to cut American consumption of Middle Eastern oil by 75% by 2025, per the latest State of the Union address.

    References:
    US Crude Oil Supply and Disposition (DoE)
    US Crude Oil Imports by Country of Origin (DoE)
    World Proved Reserves of Oil and Natural Gas, Most Recent Estimates

    Update: I've written an updated post to this; please see Update: How Much Oil Does America Import.

    Note: Despite the age of this article, it remains extremely popular, currently getting over 20% of all my hits on a daily basis. Since I wrote this post, I've written a number of other articles on oil. You might want to check out the following (so far to date; the most recent are at the top):

  • Update: How Much Oil Does America Import?
  • Crude Oil Prices, Dollars vs. Euros: Is There a Difference?
  • Petroleum and Natural Gas Proven Reserves, 2008, Top 10
  • U.S. Primary Energy Consumption by Source and Sector, 2006
  • Antonio Rappa on Oil
  • American Theocracy
  • Juan Cole on Global Warming, Oil and American Politics/Militarism
  • World Oil Reserves
  • Oil: America's Smack

    And over at one of my other blogs:

  • Southeast Asian Petroleum Consumption Forecasts, 2007-2012

    I hope to have a number of other posts like the one above at the new blog, J2TM, in the near future.
  • February 2, 2006

    Oil: America's Smack

    Another pop quiz, hotshot! Name the number one oil importer to the United States.

    Saudi Arabia? Guess again. It's Canada. In fact, Saudi Arabia comes in third, after Mexico. Yes, you may have thought that the Middle East provided the United States with most of its oil, but that's not true either. In 2004, Persian Gulf countries (defined by the US Department of Energy as consisting of Bahrain, Iran, Iraq, Kuwait, Qatar, Saudi Arabia, and the United Arab Emirates) only provided 2,400 thousand barrels of oil per day (tbpd) or 23.80% of the 10,084 tbpd total imported. If you expand the list to include other Middle Eastern countries not located in the Persian Gulf (e.g., Algeria, Libya, Syria, etc.), the total goes up to a mere 2,648 tbpd or 26.26% of the total. Finally, if you expand the list to include all Muslim-majority countries around the world (e.g., Brunei, Indonesia, Malaysia, etc.), the quantity is 3,793 tbpd or 37.61% of the total. In other words, only a little over 1/3 of America's oil imports come from Muslim countries.

    “America is addicted to oil, which is often imported from unstable parts of the world,” Mr Bush said in his State of the Union address. “By applying the talent and technology of America, this country can dramatically improve our environment, move beyond a petroleum-based economy and make our dependence on Middle Eastern oil a thing of the past.” (Source: Financial Times)

    I agree that America is addicted to oil. There's no question about that. And I have no problem with the Bush administration trying to move beyond a petroleum-based economy through "talent and technology." There's nothing wrong with that either.

    But saying that the Bush administration's goal is to cut American consumption of Middle Eastern oil by 75% by 2025 is merely a smokescreen for the ignorant. There's nothing wrong with the goal per se, but the goal won't make any real dent in America's oil addiction. If the Bush administration really wanted to cut out 75% of Middle Eastern oil, they could do so now by stopping the importation of Saudi Arabian and Iraqi oil. Those two countries, in 2004, accounted for 2,150 tbpd out of the Middle East's total of 2,648 tbpd, or 85.08% of the Middle East's total. Boom! You've not only gone past the 75% mark, but cut an additional 10% beyond that.

    But like any junkie, America will move from one supplier to another. Instead of Saudi Arabia and Iraq, the US will probably move on to one of the other big producers (if they can): Canada (1,616 tbpd or 16.03%), Mexico (1,598 tbpd or 15.85%) or Nigeria (1,078 tbpd or 10.69%). (Venezuela is the only other large importer, sending 1,297 tbpd or 12.86%, but - obviously - recent relations with that country's government would nix that idea.)

    A better suggestion by the President would have been to cut overall oil imports into the country by, say, 25%. Instead of importing 10,084 tbpd, how about dropping the number by 2,521 tbpd to 7,563 tbpd? That would not only be equivalent to stopping all imports from the Middle East, but would also provide real incentives to car and oil companies to find a meaningful solution to America's oil addiction.

    - - - - - - - - - - -

    In the meantime, the President's speech ignores reality. As he said, oil is "often imported from unstable parts of the world." And, of course, we're supposed to infer that the "unstable parts" include the Middle East and Venezuela. But even if the US imported oil from "stable parts of the world," that oil in the "unstable parts" will still be sought out by other countries. All of the world is "addicted" to oil, not just the United States. If the US stopped importing Saudi Arabian and Iraqi oil, as I suggested above, other countries (e.g., China, the European Union, Japan, etc.) would gladly pick up the slack. The oil is not going to go away. Moreover, as Frank Verrastro, director and senior fellow in the Center for Strategic and International Studies energy program said, “Even if America doesn’t import a drop of Middle Eastern oil, these countries will still play an increasingly important role in determining how much we pay for oil. You pay the global price and it doesn’t matter where you buy it from.”

    - - - - - - - - - - -

    Other reactions to Bush's speech included:

    Myron Ebell, director at the Competitive Enterprise Institute, a conservative think-tank: “The president’s hackneyed and dangerous energy rhetoric that we are addicted to oil is an indication that the administration is addicted to confused thinking about energy policies. [His goals] will be hindrances to creating a bright energy future for American consumers.”

    Jim Footner of Greenpeace: “We’ll wait and see what concrete action [Mr Bush] takes before getting our hopes up. After all, there is a treaty to reduce America’s dependence on oil – it’s called Kyoto, and Bush walked away from it.”

    Bill Prindle, the deputy director of the American Council for an Energy-Efficient Economy: "The administration has made much of its investment in energy efficient technology. However, much of this has been a reallocation of research funds. The budget requests from the White House for funding on energy efficiency has actually fallen 14 per cent in real terms since 2002."